
AI power transients: what GPU load steps do to the power system
AI racks do not draw steady power. They swing from near idle to well above nominal and back in milliseconds, thousands of times an hour. Where that energy comes from, and whether the battery has to supply it, is one of the most consequential power design decisions in an AI deployment and one of the least specified.
What AI racks actually draw
Conventional IT loads change slowly. A server farm’s draw follows the working day, and a UPS sized to a steady figure with some margin handles it comfortably. AI compute is different in kind. A GPU moves between compute, memory and communication phases on a millisecond scale, and in training every GPU in a job moves through those phases together. The swings do not average out across a rack; they add up.
The result is a load that can step from near idle to full power, overshoot above nominal for hundreds of microseconds, and drop back, repeating many times a second for as long as the job runs. Inference produces the same pattern less regularly, as batches arrive at idle servers. Either way, the power system sees a load that is spending much of its time in the region where conventional designs stop being specified.
That region matters because most double-conversion UPS designs are validated to a 100% step. Above nominal, the usual responses are to call on the battery, transfer to bypass, or trip on overload. Each is reasonable for a rare event. None is reasonable as the routine response to something the load does thousands of times an hour.
Spiky loads: three time scales, three problems
Spiky load, power swing, load volatility, burst, ramp: the words get used for behavior that spans nine orders of magnitude in time, and the fixes are completely different at each scale. Sorting them out is the first step in specifying anything.
Microseconds to milliseconds
Inside the rack. GPU clock and power-state changes move the load between idle and full in well under a millisecond, thousands of times an hour. This is what the power shelf, its capacitance and its regulation have to absorb. It is the scale this page measures.
Fix: shelf design and capacitanceSeconds to minutes
Across the hall. Training jobs start, checkpoint and finish together, so a cluster can ramp tens of megawatts in seconds. Peak-to-average ratios climb, and the answers are power capping, peak shaving and energy storage sized in megawatt-hours.
Fix: rack and cluster controls, storageHours to seasons
On the grid. Volatile campus load breaks utility forecasting, drives last-minute energy purchases and slows interconnection queues. The answers are contractual and generation-side, not equipment inside the rack.
Fix: utility planning and generationThe three interact. Intra-rack transients that a power shelf passes through show up as current pulses and harmonic distortion on the facility side, adding to what the utility already sees from cluster-scale ramping. Absorbing them where they start is the cheapest place to deal with them.
Every transient ends up somewhere
The energy for a load step has to come from somewhere in the time it takes to happen. There are three places it can come from, and each has a cost.
Upstream, from the mains
A power stage that passes the swing through presents it to the facility as current pulses and harmonic distortion. At rack scale, synchronized swings become a disturbance the electrical system and the utility both see.
Cost: power qualityDownstream, from the battery
If regulation cannot hold, the bus sags and the battery supplies the difference. Every one of those events is a discharge cycle, and battery life is counted in cycles.
Cost: battery lifeAbsorbed in between
Bulk capacitance inside the power module supplies the step and recharges between steps, while the conversion stage holds the output in regulation. Neither the mains nor the battery sees it.
Cost: designed in, not paid in serviceWhen none of these is available, the remaining option is to throttle the compute. That keeps the power system safe by giving up the performance the rack was bought for. Absorbing transients in capacitance keeps throttling as a reserve rather than making it part of normal operation.
Moving averages, not peaks
A single peak figure says very little about transient capability, because it says nothing about how long the load stays there. A 60% overshoot lasting 400 microseconds and one lasting a second are completely different problems: the first is a question of fast regulation and a little stored energy, the second is a question of whether the power stage is simply undersized.
The useful way to specify it is as load held over defined averaging windows. Xtreme Power publishes its power modules this way:
| Averaging window | Load held within regulation | What it represents |
|---|---|---|
| 400 µs | 160% of nominal | Fast overshoot at the edge of a compute phase |
| 50 ms | 136% of nominal | Sustained burst across a phase |
| 1 s | 100% of nominal | The load the module is rated to carry continuously |
The last row is the constraint that keeps the others honest: peaks are allowed because they are short, and over any second the average must not exceed the rating. A specification that states a peak without the window and the averaging rule is not specifying transient capability at all.
Capacitance for transients, battery for outages
Every Xtreme Power AI power module carries integrated bulk capacitance sized for this: 1200 J on the 18.5 kW 800 VDC module and 120 J on the 5.5 kW ORv3 50 VDC module. The capacitance supplies the step; the conversion stage holds the output in regulation and recharges it before the next one.
In the 800 VDC system, the battery is arbitrated by voltage rather than by a transfer decision. The regulation window for dynamic loading is ±3%, which on an 800 V bus is 776 to 824 V. The battery discharge threshold is set at exactly 776 V, the lower edge of that window.
That is a deliberate choice. The battery supplies current only when the power modules can no longer hold the bus inside its dynamic regulation window. As long as the transient is absorbed within regulation, the battery never sees it, and its life is spent on loss of supply rather than on the workload.
The ORv3 AX5-33 takes a different route to the same end. Where a pulse outlasts what module capacitance can hold, the module signals the battery shelf to share load rather than letting the 50 VDC rail droop, so the rack sees regulated voltage either way.
24 load profiles, battery never engaged
The 18.5 kW 800 VDC power module was tested against the dynamic loading profiles of OCP Diablo 400 section 7.3.3, the DC output dynamic loading section of the OCP Diablo 400 Project: Rack and Power base specification, version 0.7.0, effective 1 March 2026. The specification requires the output to stay within ±3% with 3 ms settling, and states that battery backup should not be triggered during dynamic loading. Testing was at 415 VAC input and 800 VDC output, with a 1 A/µs slew rate on all but one profile.
Measured minimum and maximum bus voltage for each of the 24 profiles. The shaded band is the ±3% window required by OCP Diablo 400 section 7.3.3. The lowest reading on any profile was 784.3 V, on a 40 to 175% pulse, 8.3 V above the battery discharge threshold. The highest was 809.9 V.
Step loads (OCP Table 7)
Square-wave steps at 50% duty, each run at four frequencies. The smaller steps were run up to 10 kHz; the 10 to 150% step up to 4 kHz.
| Load step | Frequencies tested | Min (V) | Max (V) |
|---|---|---|---|
| 10 → 60% | 20 Hz to 10 kHz | 798.5 | 809.3 |
| 50 → 100% | 20 Hz to 10 kHz | 793.2 | 806.3 |
| 10 → 100% | 20 Hz to 6.5 kHz | 793.7 | 809.6 |
| 10 → 150% | 20 Hz to 4 kHz | 786.4 | 809.9 |
Pulse loads (OCP Table 8)
Pulses from 50 µs to 50 ms, including the two profiles the specification sets at 175% of nominal.
| Load pulse | Pulse width | Repetition | Min (V) | Max (V) |
|---|---|---|---|---|
| 70 → 130% | 0.05 ms | 10 kHz | 793.9 | 801.9 |
| 20 → 140% | 0.1 ms | 5 kHz | 794.9 | 804.0 |
| 40 → 175% | 2 ms | 222 Hz | 784.3 | 807.9 |
| 0 → 80% | 1 ms | 500 Hz | 796.2 | 809.6 |
| 20 → 140% | 50 ms | 10 Hz | 790.8 | 808.4 |
| 60 → 140% | 50 ms | 10 Hz | 788.9 | 805.2 |
| 30 → 140% | 50 ms | 12.7 Hz | 787.8 | 808.8 |
| 30 → 175% | 0.4 ms | 1.2 kHz | 787.4 | 807.2 |
Two of the pulse profiles run to 175%: 175% for 2 ms, and 175% for 400 µs repeated at 1.2 kHz. Both are profiles the specification sets out in its own pulse table, and both passed. The specification also calls for a load step under 2 ms at 175% of rack TDP. The module’s published rating stays at the conservative 160% for 400 µs; the measured results show the margin behind it.
Keeping the swings off the mains
Absorbing transients downstream is half the problem. The other half is not passing them upstream. A power stage that follows the load on its input draws the same pulsed current from the facility, and at rack and row scale, synchronized pulses become harmonic distortion and voltage disturbance that the rest of the electrical system shares.
Across all 24 profiles, input power factor held at 0.99 or better on every phase, and input current THD stayed at 8.5% or less, typically under 6%. That was measured while the output stepped between 10 and 150% of rated load at up to 4 kHz. The facility sees something close to a steady, well-behaved load even while the rack is doing the opposite.
What to ask a power vendor
Transient capability is easy to claim and rarely specified precisely. These questions separate a stated capability from a demonstrated one.
- What load is held within regulation, over which averaging windows? Ask for at least a sub-millisecond, a tens-of-milliseconds and a one-second figure. A peak without a window is not a specification.
- What regulation window was held during the step? Ask for the measured minimum and maximum, not only a pass or fail.
- Which step and pulse profiles were tested, at what frequency and slew rate? A 100% step at 20 Hz and a 150% step at 4 kHz are different tests.
- Did the battery engage on any profile? If it did, ask how many cycles a year the workload will cost it.
- Where is the battery discharge threshold, relative to the regulation window? It should sit below the dynamic window, not inside it.
- What happens to input power factor and current THD during dynamic loading? Static figures at steady load say nothing about behavior under AI load.
- What is the response when a transient exceeds the envelope? Trip, bypass, battery, or a signal to the IT rack to reduce load. Each has different consequences.
Where Xtreme Power fits
Xtreme Power builds power for both routes to 50 VDC at the AI rack: direct conversion at the rack, and 800 VDC distribution stepped down where the load is. All are preliminary and not yet in production.
 Direct 50 VDC · ORv3
AX5-33
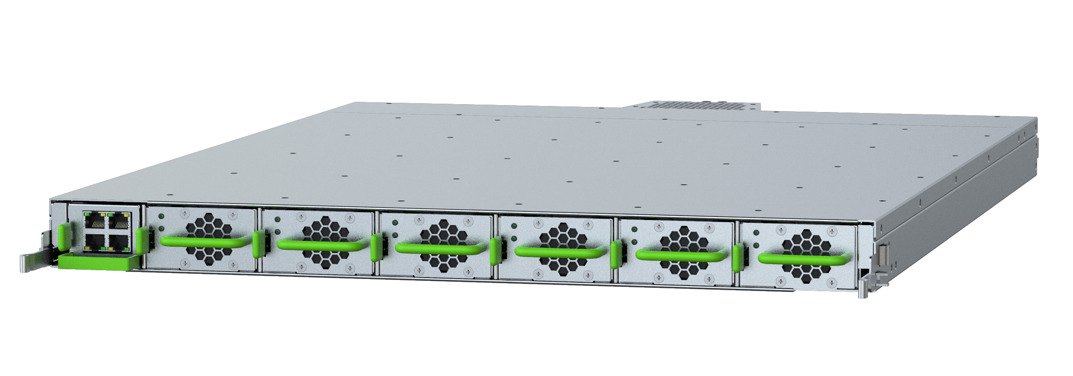
33 kW in 1 OU from six 5.5 kW modules with 120 J each. AC or 180 to 400 VDC input. Rated 160% for 400 µs, 136% for 50 ms, 100% for 1 s.
View the AX5-33 → AC to 800 VDC
AX8-110
110 kW from six 18.5 kW modules with 1200 J each: the module tested to the 24 profiles above. The 7U AX8E-110 adds LFP ride-through of 110 kW for 90 seconds or more, at the top of the 45 to 90 second backup range the specification calls for.
View the AX8-110 → 800 VDC to 50 VDC
DX8-90
90 kW in 1U from six 15 kW DX8-150 modules at up to 98.5% efficiency, keeping the 1,800 A path inside the rack on a short busbar.
View the DX8-90 →For the architecture decision between rack-level and centralized protection, see rack UPS vs centralized UPS.
AI power transients: frequently asked questions
Is this the same as the megawatt-scale AI load spikes utilities are worried about?
No, though they are related. The utility concern is clusters ramping tens of megawatts in seconds as training jobs start, checkpoint and stop, which breaks load forecasting and stresses interconnection. This page is about what happens inside the rack, in microseconds to milliseconds, where GPU power-state changes swing the load thousands of times an hour. Rack-level spiky load is absorbed by shelf design and capacitance; cluster-level ramping is managed with power capping, peak shaving and energy storage. A power shelf that passes its transients through adds to the facility-side problem, so the two are worth solving together.
What is an AI power transient?
A spiky load: a rapid change in the power an AI rack draws, as GPUs move between idle, compute and communication phases. Training and inference both produce them: load can swing from near idle to above nominal and back in milliseconds, thousands of times an hour, and synchronized GPUs across a rack or row swing together rather than averaging out.
Why can’t a conventional UPS simply absorb AI load steps?
Most double-conversion UPS designs are validated to a 100% load step. Beyond that, the usual responses are to draw on the battery, transfer to bypass, or shut down on overload. None of those is acceptable as a routine response to something the load does thousands of times an hour. Handling AI transients means holding regulation above nominal, briefly, without any of them.
Should the battery handle GPU load steps?
No. Every discharge is a cycle, and lithium battery life is counted in cycles. A battery that responds to routine compute transients wears out on a schedule set by the workload rather than by outages. The better design absorbs transients in capacitance and keeps the battery in reserve for loss of supply.
What is the OCP Diablo 400 dynamic loading test?
It is section 7.3.3 of the OCP Diablo 400 Project: Rack and Power base specification, version 0.7.0, effective 1 March 2026, contributed by Microsoft, Meta and Google. It defines step and pulse load profiles, requires the output to stay within ±3% with 3 ms settling, and requires that battery backup is not triggered during dynamic loading. Xtreme Power cites it as the test method its 800 VDC power module was measured against, not as a claim of compliance with an OCP rack architecture.
Do AI load swings disturb the utility supply?
They can. A power stage that passes load swings straight through to its input shows them to the upstream electrical system as current pulses and harmonic distortion. Across all 24 test profiles, the 800 VDC power module held input power factor at 0.99 or better and input current THD at 8.5% or less, typically under 6%, while stepping from 10 to 150% at up to 4 kHz.
How should I specify transient capability?
As moving averages over defined windows rather than a single peak figure, for example 160% for a 400 µs average, 136% for 50 ms and 100% for 1 s, together with the step and pulse profiles the equipment was tested against, the regulation window it held, and whether the battery engaged. A single peak number says nothing about duration, which is what determines whether the energy has to come from somewhere.
PRELIMINARY. Products described are not yet in production and specifications are subject to change. Test results are from factory dynamic load testing of the 18.5 kW 800 VDC power module to OCP Diablo 400 section 7.3.3 Tables 7 and 8, dated May 2026. OCP Diablo 400 section 7.3.3 is cited as the test method; this is not a claim of compliance with an OCP rack specification.
Specify AI power with measured transient data
Xtreme Power engineers can share full test results, discuss your rack’s load profile, and help size ride-through for your site’s generator arrangement.